")
Local education inequities across U.S. revealed in new Stanford data set
Almost every school district enrolling large numbers of low-income students has an average academic performance significantly below the national grade-level average, according to Stanford Graduate School of Education research based on a massive new data set recently created from more than 200 million test scores.
The research also revealed that nearly all U.S. school districts with substantial minority populations have large achievement gaps between their white and black and white and Hispanic students.
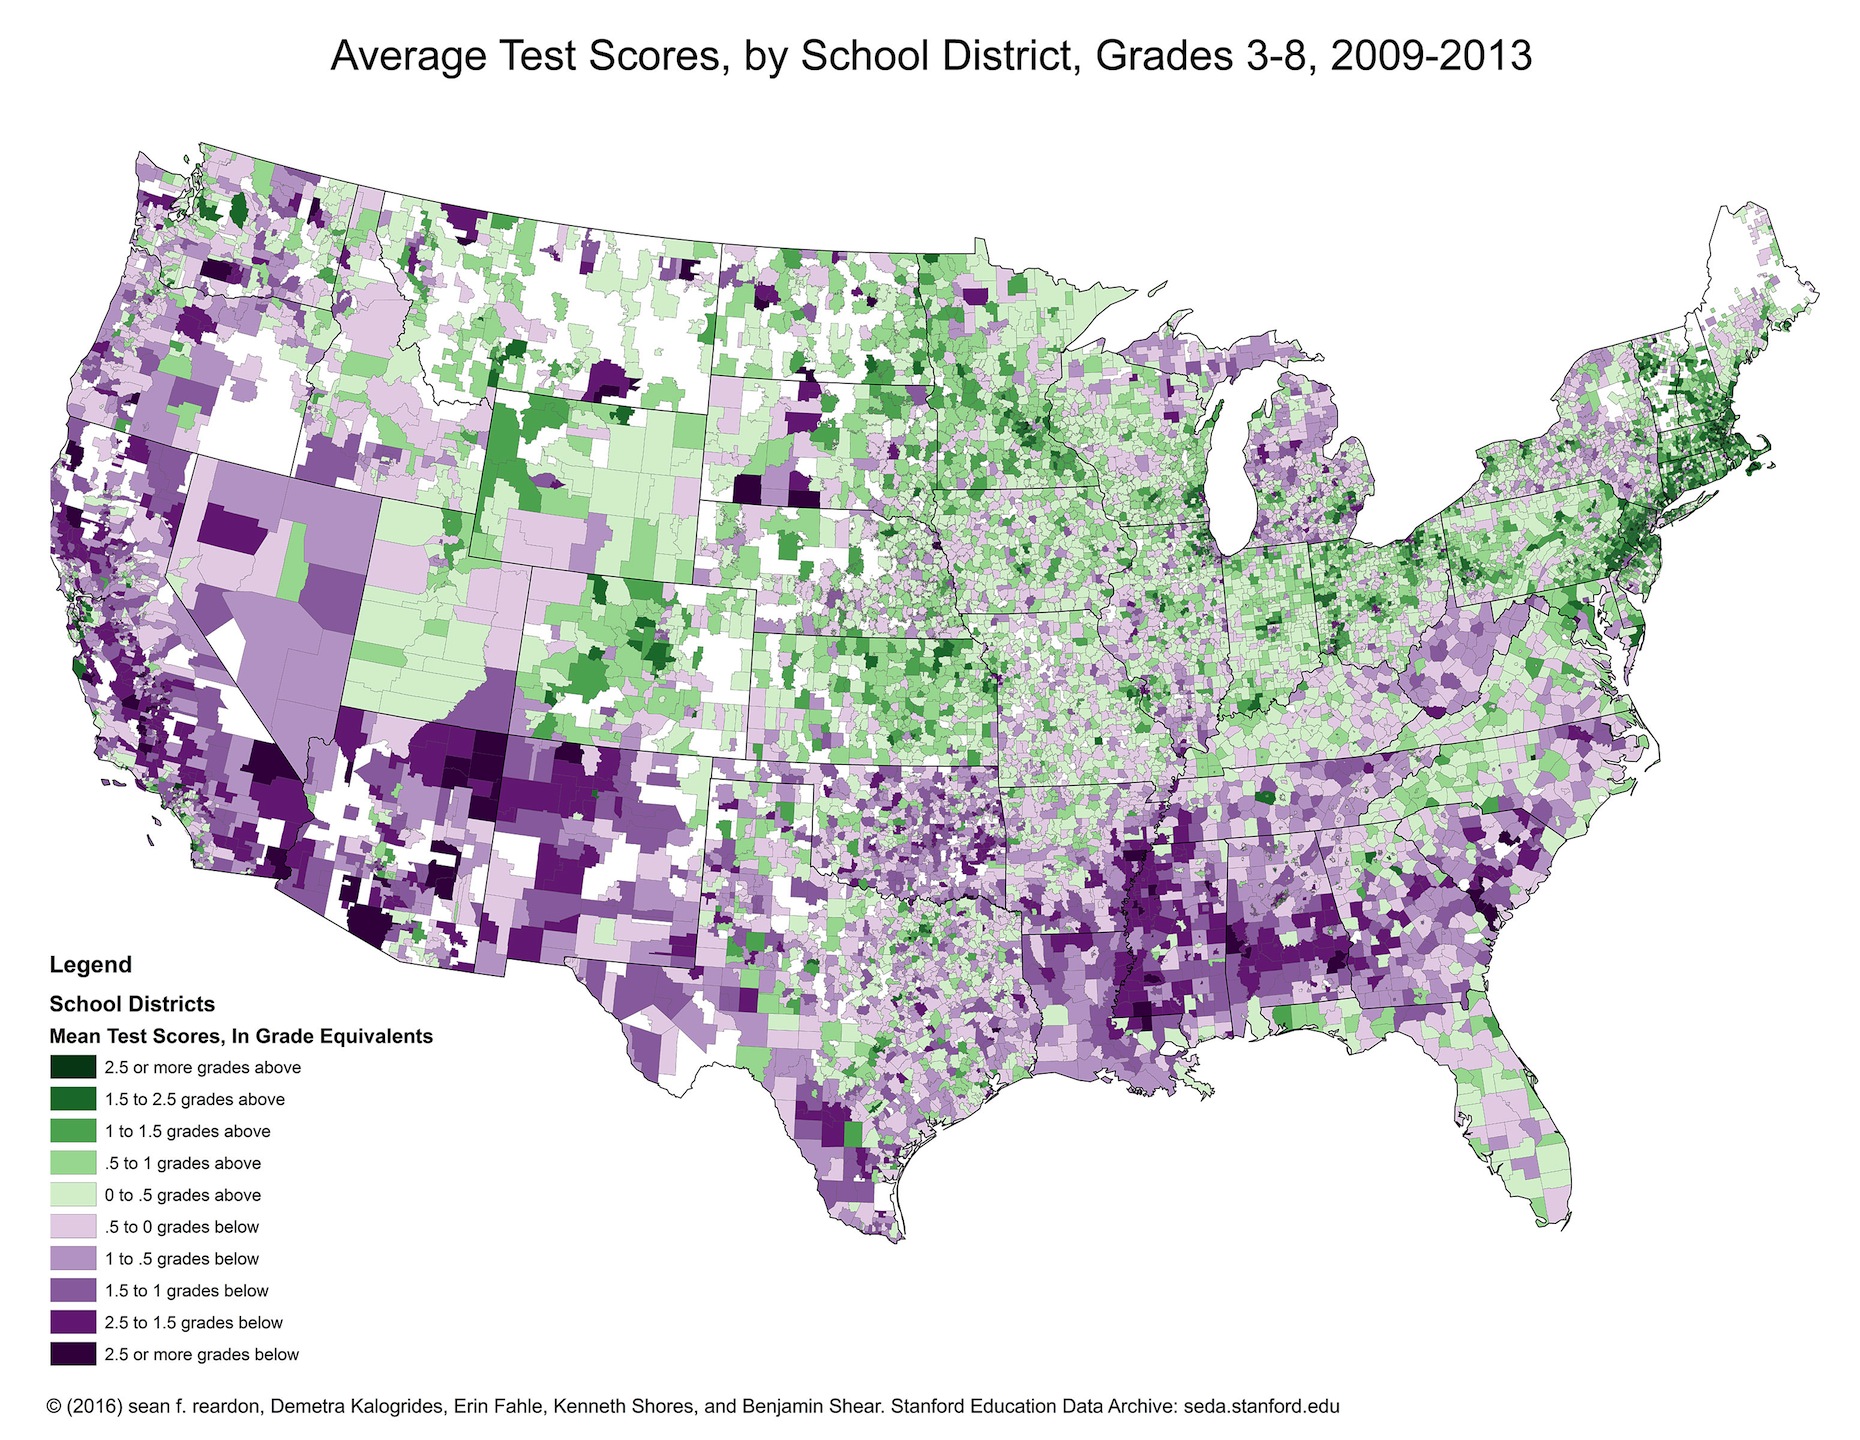 The data set reveal where students are performing above and below the national level. (Stanford Educational Data Archive)
The data, which were made available online April 29, provide the most detailed account yet of academic disparities nationwide. They comprise reading and math test results of some 40 million 3rd to 8th grade students during 2009-13 in every public school district in the country, along with information about socioeconomic status, school district characteristics, and racial and economic segregation.
Find your district using an interactive graphic in The New York Times
“We don’t administer a single standardized exam to all U.S. students, so a clear picture of the differences in academic performance across schools and districts has been elusive up until now,” said Sean Reardon, the Stanford education professor who devised the statistical methods that make it possible to compare the mandatory tests administered in different states. “It’s now much easier to identify school districts and communities where performance is high, compare them with demographically similar ones that do less well and try to determine what’s behind the differences.”
Educational inequality
Reardon and colleagues already have been examining the data and identifying key patterns in educational inequality.
Among their findings:
- One sixth of all students attend public school in school districts where average test scores are more than a grade level below the national average; one sixth are in districts where test scores are more than a grade level above the national average.
- The most and least socioeconomically advantaged districts have average performance levels more than four grade levels apart.
- Average test scores of black students are, on average, roughly two grade levels lower than those of white students in the same district; the Hispanic-white difference is roughly one- and-a-half grade levels.
- Achievement gaps are larger in districts where black and Hispanic students attend higher poverty schools than their white peers; where parents on average have high levels of educational attainment; and where large racial/ethnic gaps exist in parents’ educational attainment.
- The size of the gaps has little or no association with average class size, a district’s per capita student spending or charter school enrollment.
The researchers stress that their findings do not prove cause and effect, though they do point to promising areas for further study.
“The socioeconomic profile of a district is a powerful predictor of the average test score performance of students in that district,” Reardon said. “Nonetheless, poverty is not destiny: There are districts with similarly low-income student populations where academic performance is higher than others. We can – and should – learn from such places to guide community and school improvement efforts in other communities.”
Racial segregation
In a paper posted online accompanying the data, Reardon specifically examines the relationship between segregation and academic achievement. Reardon uses 16 different measures of segregation to identify which aspects of racial segregation are most strongly associated with academic achievement. “The racial difference in the proportion of students’ schoolmates who are poor is the key dimension of segregation driving [the association],” he writes.
The finding leads Reardon to suggest that racial segregation is inextricably linked to unequal allocation of resources among schools; and that policies that don’t address this will fail to remedy racial inequality. “In sum, racial integration remains essential for reducing racial disparities in school poverty rates,” he concludes.
Watch Reardon's interview with Education Week
In another paper posted with the data, Reardon and colleagues focus on how geography correlates with disparities by race and ethnicity. The researchers identify large white‐black achievement gaps in such major school districts as Atlanta; Auburn City, Alabama; Oakland, California; Tuscaloosa, Alabama; Charleston, South Carolina; and Washington, D.C. They also find significant black-white gaps in a number of smaller school districts that are home to major universities: Berkeley, California; Chapel Hill, North Carolina; Charlottesville, Virginia; Evanston, Illinois; and University City, Missouri.
 Sean Reardon devised the statistical methods that made it possible to compare across schools and districts the mandatory standardized tests administered in different states. (Photo: Marc Franklin)
According to the researchers, the list of places with the largest white‐Hispanic gaps includes Atlanta, Berkeley, Chapel Hill and Washington, D.C.
“One very important takeaway is that there is not one single race/ethnic gap or income gap in the U.S. but rather that these gaps vary considerably by where one lives,” said Jane Waldfogel, professor of social work and public affairs at Columbia University and an authority on early childhood and inequality. “This raises the challenge for all of us as researchers to better understand what drives that geographic variation and in particular to understand what factors help lead to smaller gaps.”
Rucker Johnson, an economist at the University of California, Berkeley, who studies inequality in education, added: “The new data will allow future studies to merge other data about school practices and school context to investigate the extent to which these achievement gaps can be traced back to – and are causally related to – educational opportunity gaps and specific aspects of school quality.”
Neither Waldfogel nor Johnson were directly involved with the Stanford research.
Reardon noted that the testing data have a small margin of error. “The data should not be used to rank school districts whose performance differs only slightly,” he said.
He also warned that the achievement patterns identified in the research do not indicate which school districts are more effective than others. “Test scores are shaped by many factors: home environments, neighborhoods, childcare and preschool experiences, and after-school experiences, as well as by school experiences,” he said.
The two studies and the data can be downloaded free from the Stanford Education Data Archive, which also has maps, graphs, charts and explanatory text. Although neither of the papers has yet been published, the paper by Reardon has been peer reviewed and accepted for publication by Russell Sage Foundation Journal of the Social Sciences. The data and research findings also have been presented by Reardon at a number of scholarly conferences, including the Association for Public Policy and Management’s 2015 research conference.
The research was supported by grants from the U.S. Department of Education’s Institute of Education Sciences, the Spencer Foundation and the William T. Grant Foundation.
Reardon’s research team at Stanford includes research associate Demetra Kalogrides, recent PhD recipient Kenneth Shores and doctoral student Ben Shear. Andrew Ho of Harvard Graduate School of Education and Katherine Castellano of UC-Berkeley Graduate School of Education also worked with Reardon on the project.
More resources:
The Stanford Educational Data Archive, led by Reardon, is available here.
The New York Times interactive and story about the data are available here.
Coverage by Education Week, including a video interview with Reardon, is available here.
Faculty mentioned in this article: sean reardon